Data tool · project 05 of 19
Utility analytics.
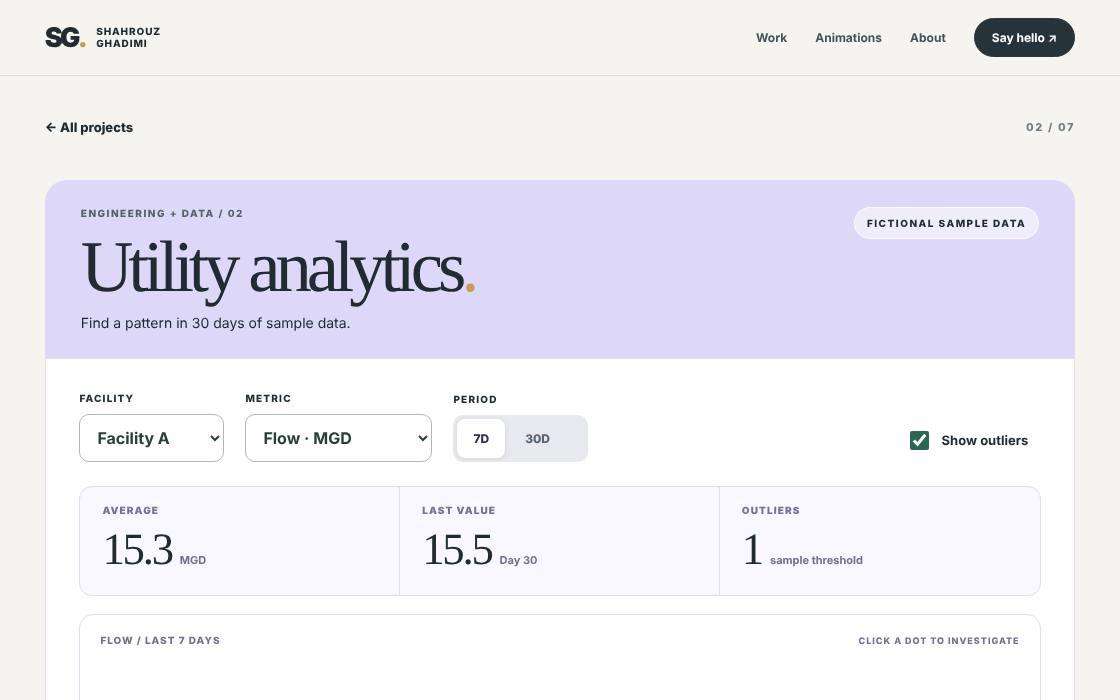
Spot what changed in 30 days of plant data.
How to use it
- Pick a facility and a metric.
- Choose 7 or 30 days and turn outliers on.
- Click any point on the chart to compare it with the period average.
Where it helps most
- Teaching operators and analysts to ask "what changed?" before "what is wrong?"
- A template for a small daily-numbers page for a plant, a shop or a clinic.
- Practising on made-up data before pointing it at real data.
The idea
Operations data is only useful when you can spot what changed. I wanted a small lab where you pick a facility and a metric, see the trend, and click any point to investigate it against the period average.
The build
Claude generated deterministic sample data, drew an SVG time-series with clickable points and outlier highlighting, wired facility, metric and period controls, and deployed it on sghadimi.com. All data is fictional by design.
Free to take
Build your own.
Copy the skill, paste it into your own AI, and say what you want different. How to use a skill, step by step ›
Get the skillThe instructions your AI follows. Works in Claude, ChatGPT, Gemini or any other
Build a self-contained 'operations lab' web page that teaches people to investigate time-series data from a water or wastewater facility.

Features:
1. Controls: facility (A/B/C), metric (flow MGD, energy kWh/day, turbidity NTU), period (7 or 30 days), 'show outliers' toggle.
2. Generate 30 days of deterministic sample data per facility and metric (seeded, so it is identical on every load). Label it clearly as fictional.
3. Draw the series as an SVG line with a soft area fill and a dot per day. Dots above a threshold (e.g. 1.2 × average) are outliers and drawn larger.
4. Summary tiles: average, last value, outlier count.
5. Clicking or keyboard-selecting a dot shows its value, the difference from the average in %, and a one-sentence plain-language insight.
6. No chart library, no network, responsive, accessible (role=img with an aria-label, focusable dots).

Optional: let me paste a CSV of my own (date,value) to replace the sample data.
Get the code2 files, exactly as they run on this site
analytics logic (app.js)59 lines
  // 02 UTILITY ANALYTICS — synthetic 30-day data, actual selectable points.
  const facilities={a:{factor:1},b:{factor:.78},c:{factor:1.23}};
  const metricInfo={flow:{base:14,unit:'MGD',precision:1,limit:1.21,title:'Flow'},energy:{base:4200,unit:'kWh/day',precision:0,limit:1.20,title:'Energy'},turbidity:{base:.52,unit:'NTU',precision:2,limit:1.80,title:'Turbidity'}};
  function sampleData(facility,metric){
    const m=metricInfo[metric],f=facilities[facility].factor;
    return Array.from({length:30},(_,i)=>{
      const wobble=1+.07*Math.sin(i*.87+(['a','b','c'].indexOf(facility)+1))+.06*Math.cos(i*.32+metric.length);
      const incident=[11,25].includes(i)?(metric==='turbidity'?2.25:1.35):1;
      return {day:i+1,value:Math.max(0,m.base*f*wobble*incident)};
    });
  }
  const fmt=(num,p)=>num.toLocaleString('en-US',{minimumFractionDigits:p,maximumFractionDigits:p});
  function initAnalytics(){
    let period=7,chosen=null;
    function paint(){
      const metric=$('#metric-select').value,facility=$('#facility-select').value,m=metricInfo[metric];
      const data=sampleData(facility,metric).slice(-period);
      const mean=data.reduce((sum,p)=>sum+p.value,0)/data.length;
      const threshold=m.base*facilities[facility].factor*m.limit;
      const alerts=data.filter(p=>p.value>threshold);
      setText('#metric-average',fmt(mean,m.precision));setText('#metric-units',m.unit);
      setText('#metric-last',fmt(data.at(-1).value,m.precision));setText('#last-note','Day '+data.at(-1).day);
      setText('#metric-outliers',alerts.length);
      setText('#plot-title',`${m.title.toUpperCase()} / LAST ${period} DAYS`);
      setText('#chart-axis-start','Day '+data[0].day);setText('#chart-axis-end','Day '+data.at(-1).day);
      const low=Math.min(...data.map(x=>x.value))*0.85,high=Math.max(...data.map(x=>x.value))*1.13;
      const y=v=>270-215*(v-low)/(high-low||1),x=i=>40+i*820/(data.length-1);
      const coords=data.map((p,i)=>[x(i),y(p.value)]);
      $('#chart-line').setAttribute('d',coords.map(([xx,yy],i)=>(i?'L':'M')+xx.toFixed(2)+' '+yy.toFixed(2)).join(' '));
      $('#chart-area').setAttribute('d',coords.map(([xx,yy],i)=>(i?'L':'M')+xx.toFixed(2)+' '+yy.toFixed(2)).join(' ')+'L860 270L40 270Z');
      const grid=$('#chart-grid');grid.replaceChildren();
      for(let i=0;i<4;i++){const line=document.createElementNS(namespaces,'line');const yy=56+i*69;line.setAttribute('x1','40');line.setAttribute('x2','860');line.setAttribute('y1',yy);line.setAttribute('y2',yy);line.setAttribute('stroke','#d9d1ed');line.setAttribute('stroke-dasharray','4 7');grid.append(line);}
      const dots=$('#chart-points');dots.replaceChildren();
      for(const [i,p] of data.entries()){
        const isAlert=p.value>threshold,showAlerts=$('#show-alerts').checked;
        const dot=document.createElementNS(namespaces,'circle');dot.setAttribute('cx',coords[i][0]);dot.setAttribute('cy',coords[i][1]);dot.setAttribute('r',chosen===p.day?9:isAlert&&showAlerts?8:5);
        dot.setAttribute('fill',isAlert&&showAlerts?'#e78572':'#7962c8');dot.setAttribute('class','plot-dot'+(chosen===p.day?' selected':''));
        dot.setAttribute('tabindex','0');dot.setAttribute('role','button');dot.setAttribute('aria-label',`Day ${p.day}, ${fmt(p.value,m.precision)} ${m.unit}`);
        const select=()=>{chosen=p.day;showInsight(p,mean,threshold,m,isAlert);paintDots();};
        dot.addEventListener('click',select);dot.addEventListener('keydown',e=>{if(e.key==='Enter'||e.key===' '){e.preventDefault();select();}});dots.append(dot);
      }
      function paintDots(){for(const dot of $$('.plot-dot',dots)){const idx=[...dots.children].indexOf(dot);const on=data[idx].day===chosen;dot.classList.toggle('selected',on);dot.setAttribute('r',on?9:(data[idx].value>threshold&&$('#show-alerts').checked)?8:5);}}
      function showInsight(p,avg,lim,mi,alert){
        setText('#insight-title',`Day ${p.day} · ${fmt(p.value,mi.precision)} ${mi.unit}`);
        const offset=(100*(p.value/avg-1));
        setText('#insight-text',`${offset>=0?'+':''}${offset.toFixed(1)}% versus the selected period average. ${alert?'This exceeds the illustrative outlier threshold. Investigate before drawing conclusions.':'Within the illustrative sample threshold.'}`);
      }
      if(chosen&&data.some(p=>p.day===chosen)){showInsight(data.find(p=>p.day===chosen),mean,threshold,m,data.find(p=>p.day===chosen).value>threshold);}else{
        chosen=null;setText('#insight-title',`${alerts.length} ${alerts.length===1?'outlier':'outliers'} in this view`);
        setText('#insight-text',alerts.length?`Days ${alerts.map(x=>x.day).join(', ')} cross the illustrative alert threshold. Select a dot to investigate.`:'No values cross the illustrative alert threshold. Select a dot for details.');
      }
    }
    $('#facility-select').addEventListener('change',()=>{chosen=null;paint();});
    $('#metric-select').addEventListener('change',()=>{chosen=null;paint();});
    $('#show-alerts').addEventListener('change',paint);
    $$('[data-period]').forEach(btn=>btn.addEventListener('click',()=>{period=Number(btn.dataset.period);chosen=null;$$('[data-period]').forEach(x=>x.setAttribute('aria-pressed',String(x===btn)));paint();}));
    paint();
  }
markup (index.html)2 lines
<template id="tpl-analytics"><div class="workspace-head analytics-head"><div><span class="overline">ENGINEERING + DATA / 02</span><h1>Utility analytics<span class="gold-point">.</span></h1><p>Find a pattern in 30 days of sample data.</p></div><span class="workspace-status">FICTIONAL SAMPLE DATA</span></div><div class="analytics-workspace"><div class="analysis-toolbar"><div class="toolbar-field"><label for="facility-select">FACILITY</label><select id="facility-select"><option value="a">Facility A</option><option value="b">Facility B</option><option value="c">Facility C</option></select></div><div class="toolbar-field"><label for="metric-select">METRIC</label><select id="metric-select"><option value="flow">Flow · MGD</option><option value="energy">Energy · kWh/day</option><option value="turbidity">Turbidity · NTU</option></select></div><div class="toolbar-field"><span class="toolbar-label">PERIOD</span><div class="segmented"><button type="button" data-period="7" aria-pressed="true">7D</button><button type="button" data-period="30" aria-pressed="false">30D</button></div></div><div class="toolbar-field"><label class="check-line anomaly-check"><input type="checkbox" id="show-alerts" checked> Show outliers</label></div></div><div class="analytics-summary"><div class="analytics-big"><span>AVERAGE</span><strong id="metric-average">—</strong><small id="metric-units">MGD</small></div><div class="analytics-big"><span>LAST VALUE</span><strong id="metric-last">—</strong><small id="last-note">Day 30</small></div><div class="analytics-big alerts-summary"><span>OUTLIERS</span><strong id="metric-outliers">—</strong><small>sample threshold</small></div></div><div class="plot-panel"><div class="plot-head"><span id="plot-title">FLOW / LAST 7 DAYS</span><span>CLICK A DOT TO INVESTIGATE</span></div><svg id="analytics-chart" viewBox="0 0 900 320" role="img" aria-label="Interactive time-series chart of illustrative utility operations data"><g id="chart-grid"></g><path id="chart-area" fill="#dcd2ff" fill-opacity=".45"/><path id="chart-line" fill="none" stroke="#7962c8" stroke-width="5" stroke-linejoin="round" stroke-linecap="round"/><g id="chart-points"></g></svg><div class="plot-axis"><span id="chart-axis-start">Day 24</span><span>DAY</span><span id="chart-axis-end">Day 30</span></div></div><div class="analysis-insight"><div><span class="overline">INVESTIGATE</span><h2 id="insight-title">Select any dot</h2><p id="insight-text">Choose a point to see its value and compare it with the period average.</p></div><div class="legend"><span><b class="line-mark"></b> Metric</span><span><b class="dot-mark"></b> Sample outlier</span></div></div></div><p class="disclosure">All 30 days are generated examples. This is not a utility dashboard or an operational recommendation.</p></template>
Have an idea of your own?
Look around your day, find the thing that wastes your time, and build the fix. Everything here is free to help you start. If you would rather I built it, or you just want to talk an idea through, write to me.